SQL Server Performance Tuning
Analyzing and Optimizing Queries Using the SSMS Execution Plan Tool
SQL Server Management Studio (SSMS) provides an execution plan tool that can be used to analyze and optimize query performance. This tool has two modes: "Include Actual Execution Plan" and "Display Estimated Execution Plan," which differ in the following ways:
Include Actual Execution Plan.
- Displays the plan used when the query is actually executed.
- Provides actual execution statistics, such as the time taken by the query and the amount of data read.
- Typically used for tuning and optimizing queries that have already been executed to understand actual performance bottlenecks.
Display Estimated Execution Plan.
- Displays the estimated plan generated by the query optimizer based on statistics.
- Provides estimated execution statistics, such as estimated row counts and estimated data read amounts.
- Typically used for analyzing queries that have not yet been executed and for checking potential performance bottlenecks.
When tuning query performance, you can follow these steps:
- Use "Display Estimated Execution Plan" to analyze the query. Especially for long-running queries, you can generate the plan results before executing the query to understand its estimated performance and identify bottlenecks.
- Based on existing performance issues, you may consider adding missing indexes or making other adjustments.
- Use "Include Actual Execution Plan" to re-execute the query to obtain actual execution statistics and verify the effectiveness of your adjustments.
Below is an example of how to use the SSMS execution plan tool:
Include Actual Execution Plan
- Click "Include Actual Execution Plan" to highlight it.
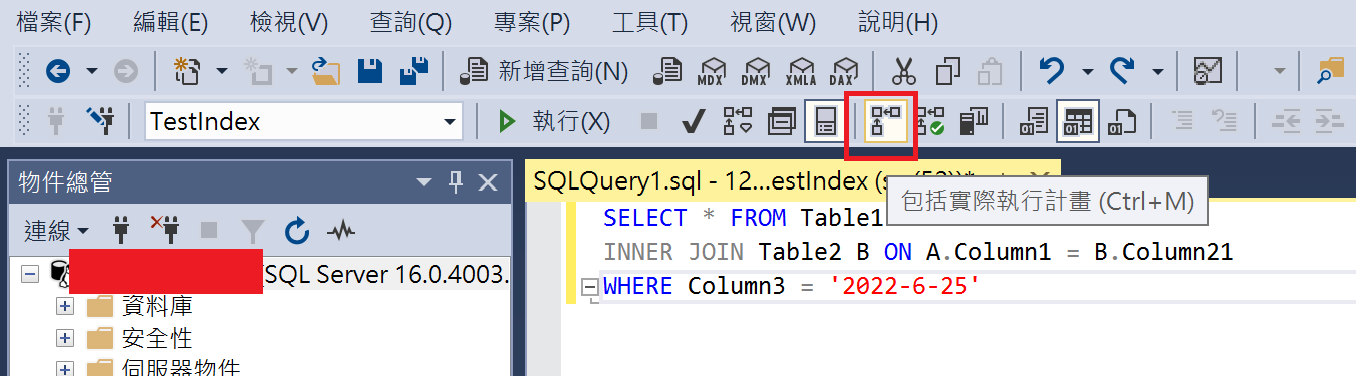
- Click "Execute" to run the query statement.
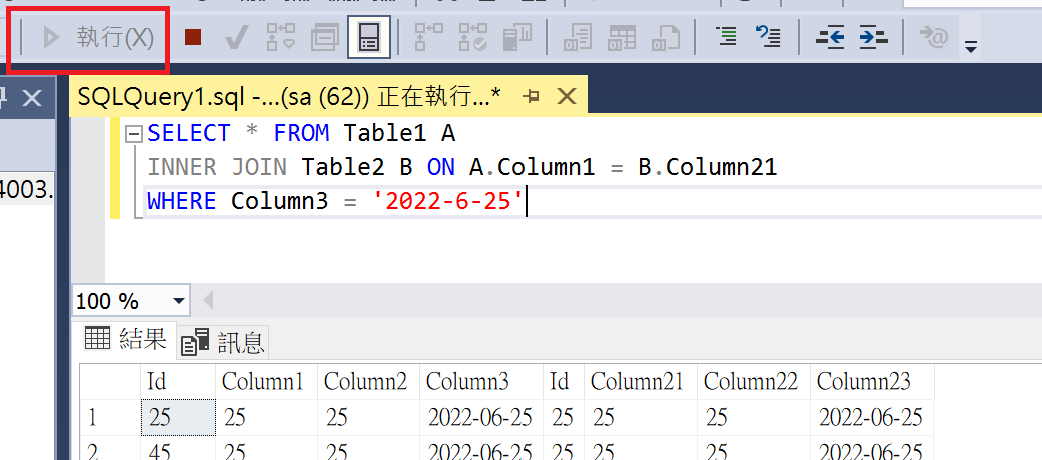
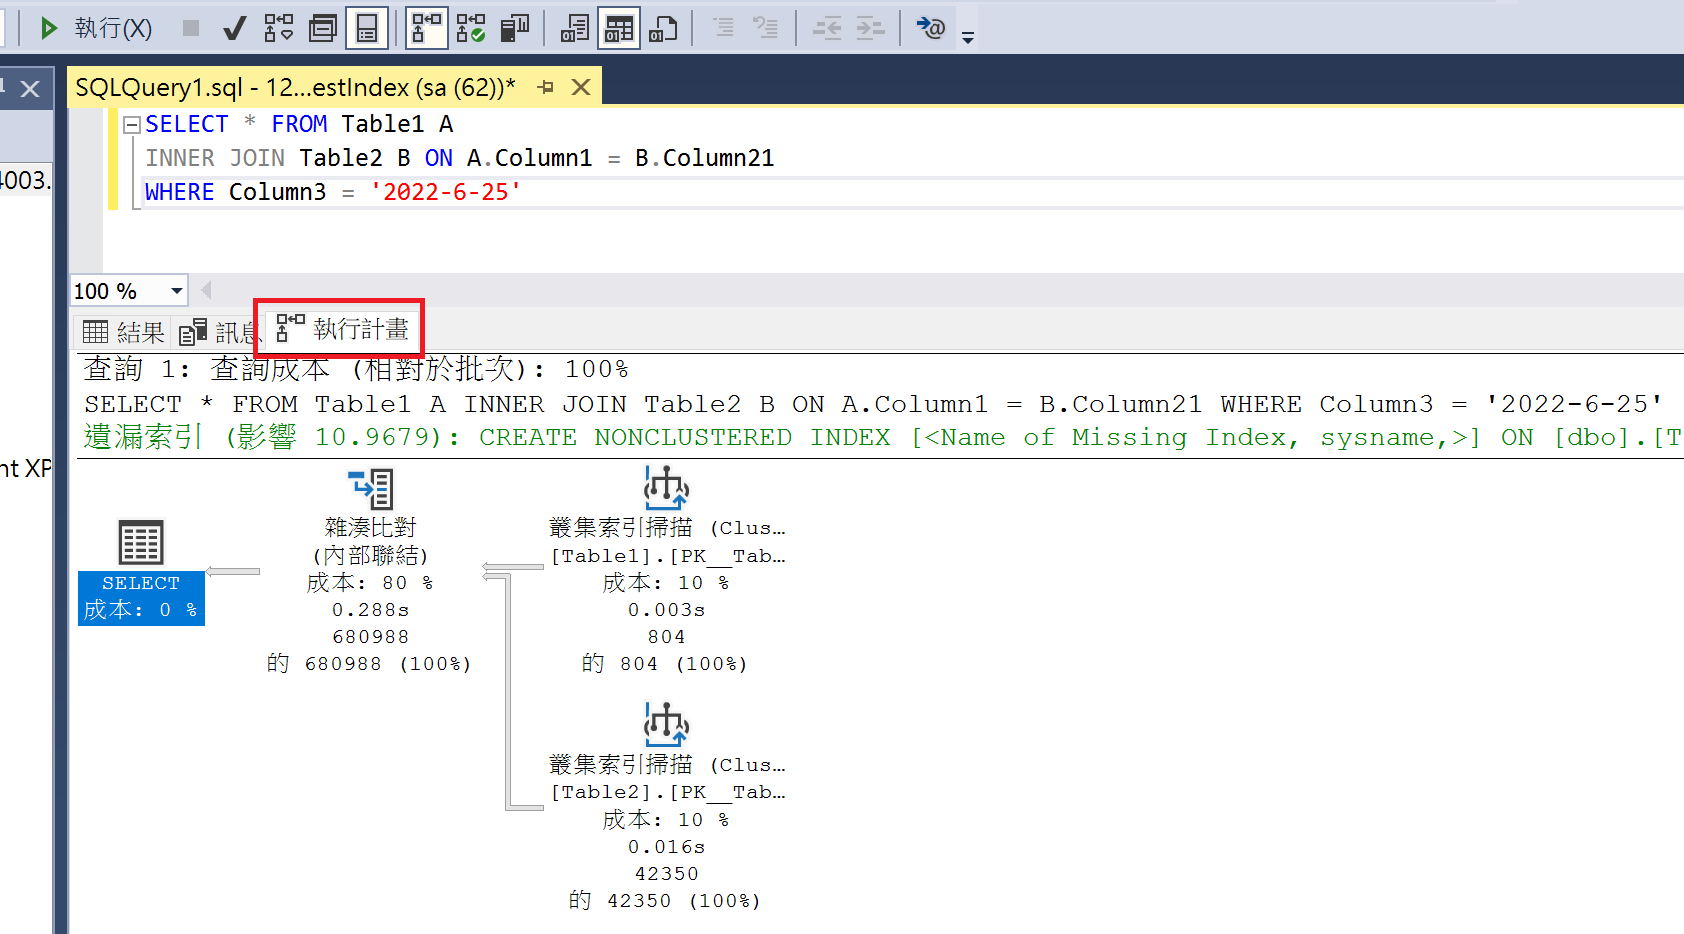
- After the query finishes, you will notice an additional "Execution Plan" tab. This tab displays the content of the execution plan, and if there are missing indexes, it will provide corresponding suggestions.
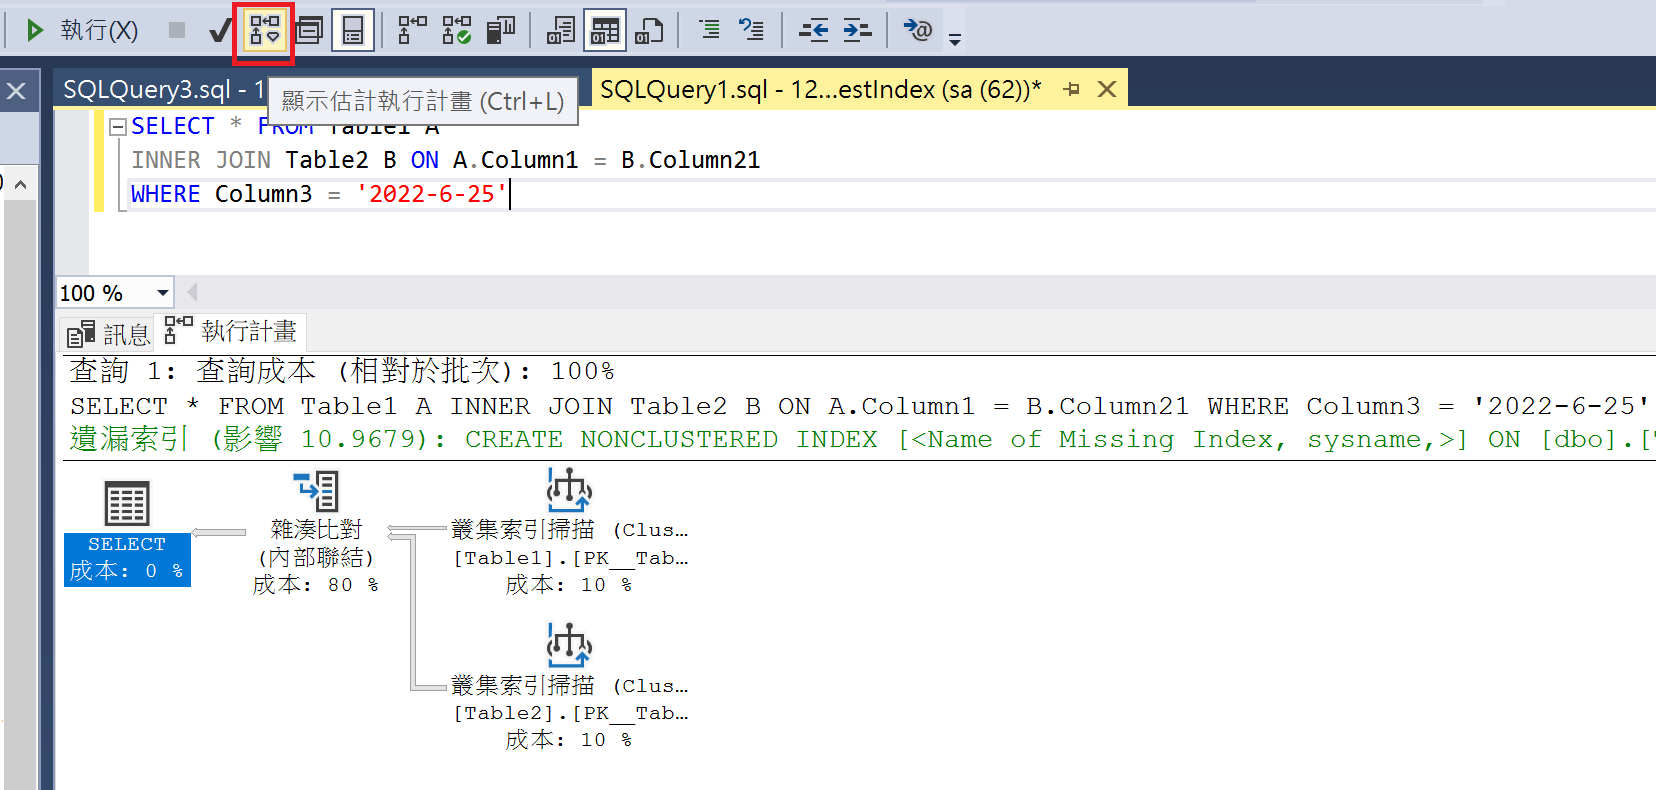
Display Estimated Execution Plan
If you click "Display Estimated Execution Plan," you do not need to click "Execute." The "Execution Plan" will be displayed directly. Since the query is not actually executed, there will be no "Results" tab.
Adding Missing Indexes
- Right-click on the "Execution Plan" and select "Missing Index Details."
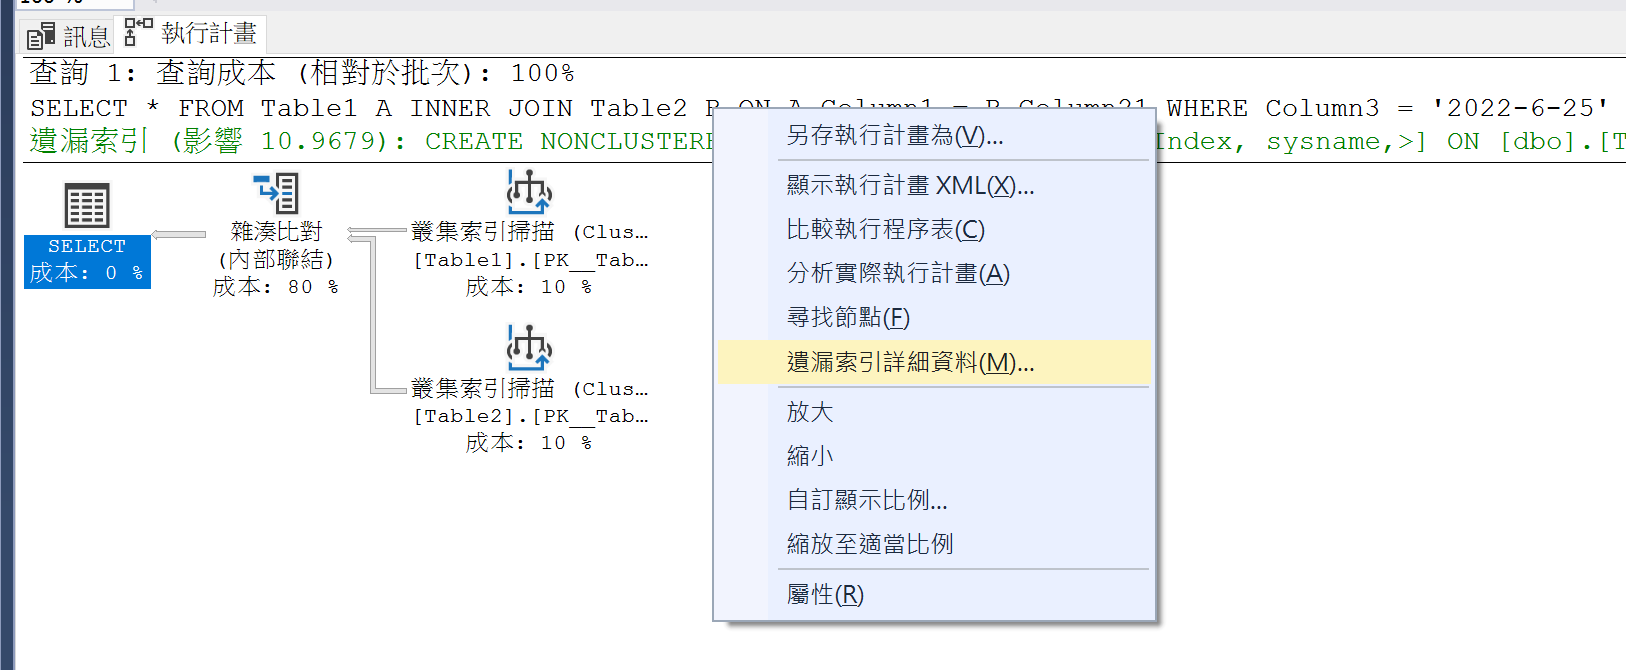
- A window will be generated containing the script to create the index, which you can use to add the missing index.
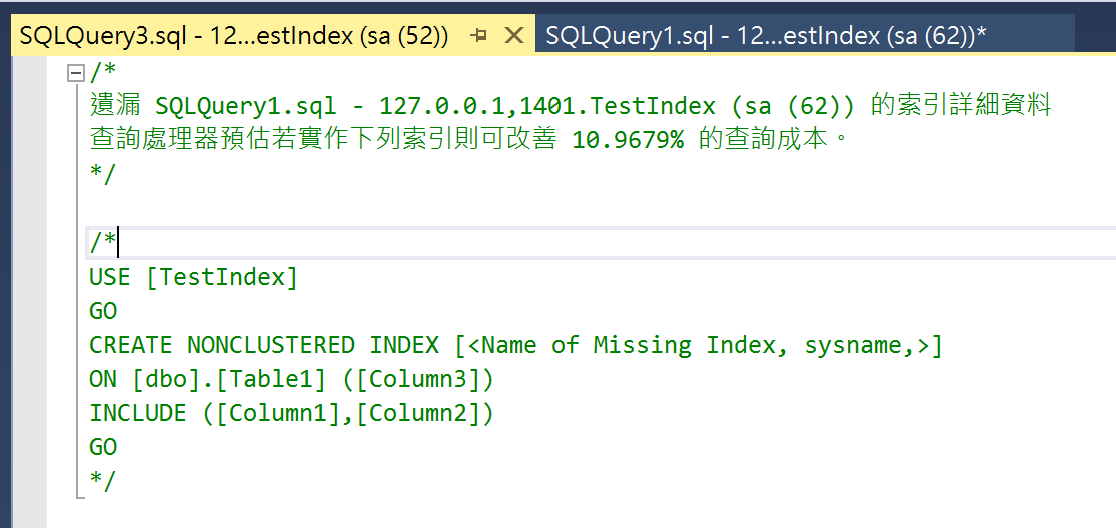
If you want to find missing indexes from execution plans stored in Dynamic Management Views, you can use the following query to generate the index creation scripts:
SELECT TOP 20
    CONVERT (varchar(30), getdate(), 126) AS runtime,
    CONVERT (decimal (28, 1),
        migs.avg_total_user_cost * migs.avg_user_impact * (migs.user_seeks + migs.user_scans)
        ) AS estimated_improvement,
    'CREATE INDEX missing_index_' +
        CONVERT (varchar, mig.index_group_handle) + '_' +
        CONVERT (varchar, mid.index_handle) + ' ON ' +
        mid.statement + ' (' + ISNULL (mid.equality_columns, '') +
        CASE
            WHEN mid.equality_columns IS NOT NULL
            AND mid.inequality_columns IS NOT NULL THEN ','
            ELSE ''
        END + ISNULL (mid.inequality_columns, '') + ')' +
        ISNULL (' INCLUDE (' + mid.included_columns + ')', '') AS create_index_statement
FROM sys.dm_db_missing_index_groups mig
JOIN sys.dm_db_missing_index_group_stats migs ON
    migs.group_handle = mig.index_group_handle
JOIN sys.dm_db_missing_index_details mid ON
    mig.index_handle = mid.index_handle
ORDER BY estimated_improvement DESC;WARNING
Do not simply create indexes based solely on missing index suggestions; many indexes can be consolidated. Too many indexes may actually degrade write performance.
References
Tune Nonclustered Missing Index Suggestions
Introduction to SQL Server Indexes
This is just a brief explanation of SQL Server indexes, as the more complex aspects are beyond my current expertise.
Indexes in SQL Server are implemented based on a B-Tree (Balanced Tree) structure, consisting of keys and pointers to the corresponding data. Indexes can be categorized into two types based on how the keys are sorted: Clustered Index and Non-Clustered Index.
- Clustered Index:
- Determines the physical order of data.
- Each table can have only one clustered index, and the index key values must be unique.
- If a table already has a clustered index, any new index created will be a non-clustered index.
- Clustered indexes are suitable for data with high continuity. GUIDs are not suitable as clustered index keys, so sequential number columns are sometimes used instead.
- Non-Clustered Index:
- A secondary index built on top of the clustered index.
- Contains the index key and a pointer to the corresponding data in the clustered index.
- A table can have multiple non-clustered indexes, and index key values can be duplicated.
TIP
Based on my habits, I use the following naming convention: Primary Key: PK_TableName. Clustered Index: CX_TableName_Column1_Column2. Non-Clustered Index: IX_TableName_Column1_Column2.
The following is the syntax for creating a non-clustered index; parts inside brackets are optional:
CREATE INDEX IndexName ON Schema1.Table1(Column1[,...N]) [INCLUDE(Column2[,...n ])];Purpose of INCLUDE
Using the INCLUDE clause allows you to include non-key columns in a non-clustered index to improve query performance. Typically, an index only contains index key columns, and other non-key columns must be read from the data pages. By using INCLUDE, you can include non-key columns directly in the index, reducing the need to read from data pages and thereby increasing query efficiency.
For example, if you have the following index:
CREATE NONCLUSTERED INDEX IX_Table1_Column1_Column2 ON [dbo].[Table1] ([Column1], [Column2]) INCLUDE ([Column3])When the query statement is as follows, Column1 and Column3 can be read from the index, while Column4 needs to be read from the data page:
SELECT Column1, Column3, Column4 FROM Table1 WHERE Column1 = 'Value'Leftmost Prefix Rule for Composite Indexes
Composite indexes follow the leftmost prefix rule during queries. An index can effectively support a query condition and provide optimal performance only when the columns used in the query condition match the leftmost contiguous columns of the index.
Suppose there is an index containing three columns (Column1, Column2, and Column3), created in the order of Column1, Column2, and Column3. According to the leftmost prefix rule, when only Column1 and Column2 are used as query conditions, the leftmost column Column1 and the subsequent column Column2 can be utilized without further scanning. However, if the query condition uses Column1 and Column3, the index can only utilize the leftmost column Column1; the Column3 column cannot be effectively utilized. If the query condition uses Column2 and Column3, the entire index cannot be effectively utilized.
TIP
It is worth noting that when the columns in the query condition do not match the leftmost prefix rule, different databases or versions may handle index usage differently. In SQL Server, according to current official documentation, the query optimizer will not use the index.
Consider the order of the columns if the index contains multiple columns. The column that is used in the WHERE clause in an equal to (=), greater than (>), less than (<), or BETWEEN search condition, or participates in a join, should be placed first. Additional columns should be ordered based on their level of distinctness, that is, from the most distinct to the least distinct.
For example, if the index is defined as LastName, FirstName the index will be useful when the search criterion is WHERE LastName = 'Smith' or WHERE LastName = Smith AND FirstName LIKE 'J%'. However, the query optimizer wouldn't use the index for a query that searched only on FirstName (WHERE FirstName = 'Jane').
However, MySQL 8.0.13 introduced a feature called "Index Skip Scan," which may still use indexes that do not conform to the leftmost prefix rule in certain situations.
Additionally, the leftmost prefix rule refers to the order of columns in the index, regardless of the order of columns in the query condition.
Handling Data Locking in Queries
When a query encounters data locking, you can choose the following methods to handle it:
NoLock
Using NoLock instructs SQL Server to ignore data locks when executing a query and read the locked data directly. However, this may result in reading data that is currently being modified by other transactions or reading changes made by uncommitted transactions, leading to incorrect or inconsistent query results. Here is an example of using NoLock:
SELECT *
FROM TableName WITH (NOLOCK)
WHERE Condition;NoWait
Using NoWait instructs SQL Server not to wait for the release of locked resources when executing a query, but to return an error message immediately. This can be used to avoid long-term blocking of queries, but it may also cause the query to fail. Here is an example of using NoWait:
SELECT *
FROM TableName WITH (NOWAIT)
WHERE Condition;ReadPast
Using ReadPast instructs SQL Server to skip data that has been locked by other transactions when reading data, and only read available data. This can be used to avoid blocking with other transactions, but it may also result in some data not being read. Here is an example of using ReadPast:
SELECT *
FROM TableName WITH (READPAST)
WHERE Condition;Parameter Sniffing
Parameter Sniffing is the process by which a database management system selects an execution plan based on the parameter values of a query. However, this can lead to problems when a query executed for the first time generates an execution plan using a specific set of parameter values that may no longer be suitable for subsequent queries.
Specifically, if the first execution of a query uses extreme parameter values, the database management system might generate and store a specific execution plan based on those values. However, when subsequent queries use different parameter values, the previous execution plan may no longer be the optimal choice, leading to degraded query performance.
Identifying Parameter Sniffing Performance Issues
When using parameterized queries, if you observe the following, it is likely that you are affected by Parameter Sniffing, causing slow query performance:
- The query takes a long time to execute when using parameterized queries.
- The same query returns to normal execution time when changed to a non-parameterized query.
Here is an example statement:
DECLARE @Name VARCHAR(50) = 'Wing';

-- Parameterized query
SELECT * FROM TableName Column = @Name;

-- Non-parameterized query
SELECT * FROM TableName Column = 'Wing';Solutions
Query Store:
This is the recommended solution for SQL Server 2016 and later versions. It continuously collects execution plans and performance data for queries. When we notice plan regression in SSMS graphical reports (such as "Regressed Queries"), where a query's performance fluctuates, we can directly use the "Force Plan" feature to lock in a stable execution plan.
WARNING
- SQL Server 2022 (16.x): Newly created databases will have Query Store enabled by default (see official blog).
- If enabled manually on older versions, be sure to check settings (such as
MAX_STORAGE_SIZE_MBandQUERY_CAPTURE_MODE) to avoid exhausting space or affecting CPU due to recording too many Ad-hoc queries.
- If enabled manually on older versions, be sure to check settings (such as
Using
OPTION (OPTIMIZE FOR):This hint allows us to guide the optimizer to generate a plan based on specific parameter assumptions:
For "Specific Values" (
@Variable = Value):Used when data distribution is extremely uneven and we want the optimizer to generate a plan based on the "most common" value. This prevents the optimizer from "sniffing" an extreme minority parameter value and generating a plan (like a full table scan) that is unsuitable for most cases.
sqlDECLARE @Status INT = 1; -- Force the optimizer to assume @Status is 1 to generate a plan, ignoring the actual passed value SELECT * FROM [Lease] WHERE [Status] = @Status OPTION (OPTIMIZE FOR (@Status = 1));
WARNING
Optimizing for bulk values ensures overall system stability, but queries for "niche values" might slow down because they are forced to use the bulk value plan (e.g., Index Scan instead of Index Seek). If the data volume is huge, you may need to use Filtered Indexes to assist.
For "Unknown Values" (
UNKNOWN): Tells the optimizer: "Do not trust the parameter value passed this time," and instead use the average statistical distribution of the column to generate a plan. This can produce a "balanced" and stable plan, avoiding drastic performance fluctuations due to different parameters.sqlSELECT * FROM TableName WHERE Condition OPTION (OPTIMIZE FOR UNKNOWN);Using
OPTION (RECOMPILE):Instructs SQL Server to recompile the plan according to the current parameter values "every time" this query is executed.
Applicable Scenario: Report-style queries that are executed infrequently but have complex parameter combinations and highly variable data distribution.
Cost: Increases CPU compilation costs; not suitable for high-concurrency OLTP queries.
sqlSELECT * FROM TableName WHERE Condition OPTION (RECOMPILE);
Clearing the Execution Plan Cache:
This is the most traditional "reset" method, forcing SQL Server to forget the old (potentially bad) plan and recompile it the next time it is executed. Suitable for emergency troubleshooting of Parameter Sniffing blocking in production environments.
sql-- Clear the plan for a "specific" query (recommended approach, minimal impact) DBCC FREEPROCCACHE ({plan_handle}); -- Clear the plan cache for the "entire" server (do not use unless necessary, as it will cause all queries to slow down momentarily) DBCC FREEPROCCACHE;How to find potential victims?
You can use the following script to find queries with high execution time variance (high Max/Avg ratio), which is usually a sign of Parameter Sniffing:
sqlSELECT TOP 20 t.text AS [SQL Text], st.execution_count, [Max Elapsed (ms)] = st.max_elapsed_time / 1000, [Avg Elapsed (ms)] = (st.total_elapsed_time / st.execution_count) / 1000, -- Max/Avg Ratio: If > 10, it represents extreme instability (fluctuating speed) [Max/Avg Ratio] = CAST(st.max_elapsed_time * 1.0 / NULLIF(st.total_elapsed_time / st.execution_count, 0) AS DECIMAL(10,2)), st.plan_handle, st.last_execution_time FROM sys.dm_exec_query_stats AS st CROSS APPLY sys.dm_exec_sql_text(st.sql_handle) AS t WHERE t.dbid = DB_ID('{YourDatabaseName}') AND st.execution_count > 50 -- Filter out occasional queries ORDER BY [Max/Avg Ratio] DESC;
Change Log
- 2023-03-15 Initial document creation.
- 2026-01-01
- Fixed an error in the Parameter Sniffing detection script where the logic was the opposite of what was expected.
- Added additional solutions for Parameter Sniffing.